Internet Scams Are Taking America’s Money
Last Updated on July 31, 2019 by hilary bird
A Nigerian prince does not have millions of dollars to share with you. The IRS is not threatening to seize your tax return. Your social security number is not suspended or compromised. These are just some of the common internet scams fraudsters use to gain personal information; thousands of people are scammed every year into giving up their identities and their money.
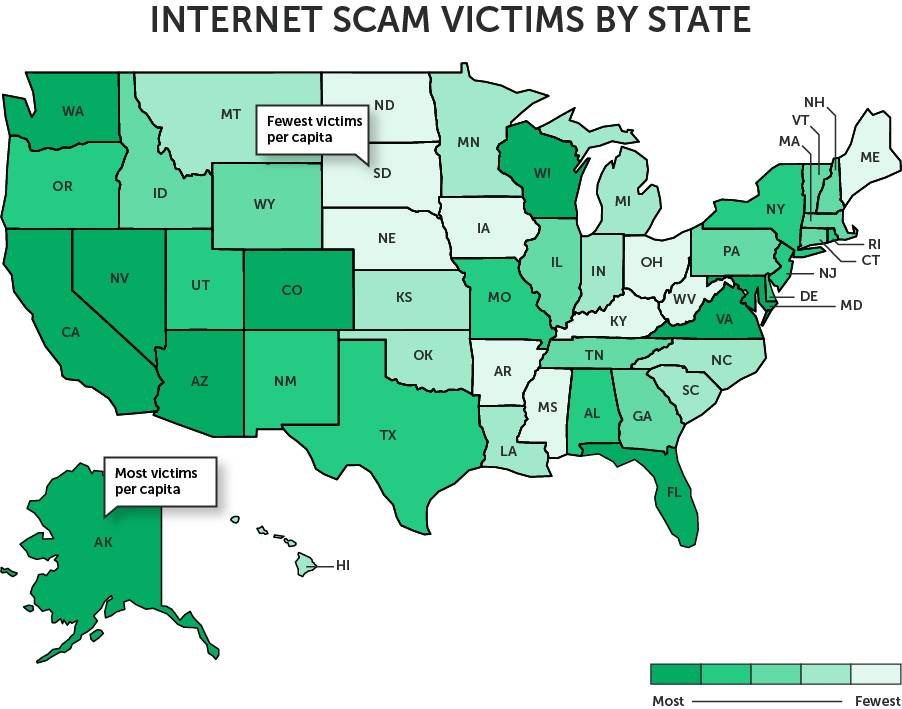
The FBI releases an annual report based on its Internet Crime Complaint Center (IC3). It breaks down the complaints, where they’re from, and the amount of money lost. The team at CenturyLinkQuote used the data to piece together which states had the most victims and lost the most money. The map below shows victim rate levels for each state to help visualize these findings.

Are You Being Scammed?
Imagine losing over $18,000 every time you were scammed. According to the 2018 report from the IC3, that’s the average amount lost by victims in North Carolina. This amounted to over $137 million lost for the entire Tar Heel State. Even with those staggering numbers, North Carolina was not the state that lost the most money in 2018. With over $450 million stolen, California lost the most money due to internet scams, with New York coming in second at $207 million.
How do these scammers succeed? There are two factors to look at: which scam affected the most victims and which scam cost Americans the most money. More victims were affected by the non-payment/non-delivery scam than any other scam out there. This happens when someone is never paid for the goods and services they provide or when they do not receive what they already paid for. Business Email Compromise (BEC) and Email Account Compromise (EAC) scams caused the most money loss. These are just like what they sound like: a business email is compromised and makes illegal wire transfers of funds into the scammer’s account. With over $1 billion lost in this scam alone, it’d be smart to make sure your email account is secure.
Fast Phishing Facts
- For the second year in a row, Alaska had the most victims per 10,000 residents at 21.67. Also for the second straight year, South Dakota had the least amount of victims per 10,000 residents at 5.35, which is an increase over last year. It’s neighbor to the north was close behind with 6.08 victims per 10,000 residents.
- Nearly 41,000 victims were scammed on social media, losing over $101 million. Another $182 million was lost through virtual currency, affecting over 36,000 people. So keep your friends close, and your virtual currency closer.
- People aged 60 and over are the most targeted age group for scammers. They lost nearly $650 million in internet scams, including confidence/relationship fraud. These scammers convince people to send money to someone who sounds trustworthy (an extended family member, a trusted brand name, or a possible romantic partner).
- BECs and EACs account for over $1 billion in losses. Confidence/relationship fraud accounts for over $360 million in losses, and investment scams rounded out the top three with over $252 million in losses.
Methodology
We used the FBI’s 2018 IC3 Report to focus on two details: victim rate and loss rate. These numbers are based on the total number of complaints when the complainant provided state information. The state population estimates came from the 2017 American Community Survey under the United States Census Bureau.
CenturyLinkQuote is an Authorized Sales Agent that offers Internet, TV and Phone Service across the United States. For media inquiries, please contact media@centurylinkquote.com


